Introduction
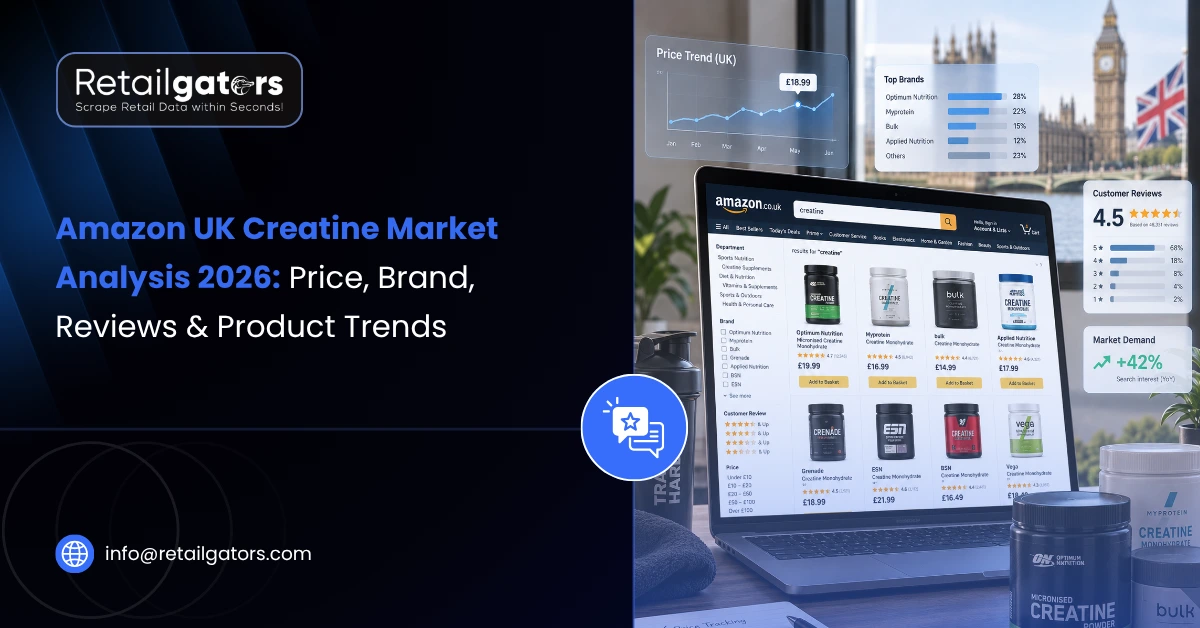
Creatine is one of the most competitive supplement categories on Amazon UK, with hundreds of products competing across price points, formats, brands, and review volumes. A 2026 category snapshot covering 429 creatine products from 232 brands shows prices ranging from £3.50 to £69, while leading products have accumulated hundreds of thousands of reviews.
This Amazon UK creatine market analysis examines what those numbers reveal about pricing, brand competition, customer ratings, product formats, and marketplace visibility. It also explains how businesses can use structured Amazon UK creatine data to benchmark competitors, track price changes, identify emerging brands, and monitor customer sentiment. Whether you sell supplements or analyze e-commerce markets, these insights provide a practical view of how the UK creatine category is evolving.
A Snapshot of the Category in 2026
The 2026 snapshot shows a highly fragmented category, with 429 products spread across 232 brands. A recent snapshot of the market covered 429 creatine products from 232 brands, with prices stretching from £3.50 all the way to £69. The £3.50-to-£69 price range suggests that Amazon UK serves both value-focused shoppers and customers willing to pay more for premium positioning, formulation, or branding.
Straight creatine powder dominates the shelf, accounting for the overwhelming majority of listings. Bars, blends, and drink mixes make up a much smaller slice. Because most brands list only one or two products each, no single company owns the space. That fragmentation is exactly what makes creatine product trends so interesting to watch over time.
Amazon UK Creatine Prices: Budget vs. Premium Products
Amazon UK creatine pricing varies significantly across products, with most listings concentrated in the £10–£20 range. The average creatine product on Amazon UK sits at £18.94, but that single figure hides a wide gap between the cheapest and priciest options. Most products cluster in the £10–£20 band, which is the comfort zone for everyday buyers.
Here is a snapshot of the price extremes pulled from the 2026 category data:
| Rank | Most Expensive Product | Price | Most Affordable Product | Price |
| 1 | MyProtein The Creatine (Micronised Monohydrate) | £69.00 | Micronised Creatine Monohydrate Powder 100g | £3.50 |
| 2 | Kollo Creatine Monohydrate Powder | £66.00 | Protein Works Creatine 360 (Micronised) | £3.90 |
| 3 | LA Muscle Explosive Creatine | £65.00 | Creatine Monohydrate Powder (Premium Micronised) | £3.90 |
| 4 | Premium Creatine Monohydrate, Creapure | £52.90 | Bodybuilding Warehouse Pure Creatine Tablets | £4.10 |
| 5 | Creavitalis Creatine Monohydrate Powder | £45.00 | Creatine Monohydrate 3000mg (90 Vegan Tablets) | £5.00 |
Price does not necessarily correspond with a higher customer rating. . A £5 tablet and a £65 powder can both carry ratings above 4.0 stars. This is precisely why a proper creatine price analysis in the UK goes beyond a one-time snapshot. Brands that want to see how prices shift week to week rely on continuous supplement market intelligence rather than a single reading.
Top Creatine Brands on Amazon UK by Product Count and Rating
Three names rise above the rest by product count: Warrior, Myprotein, and Optimum Nutrition. Each brand shows a different combination of product breadth, pricing, and customer ratings.
- Warrior — the volume-and-value leader, with 27 listings at an average price of around £12, making it the most visible budget option on the shelf.
- Myprotein — 17 products at roughly £17 average, paired with a solid 4.5 rating and aggressive sponsored placement.
- Optimum Nutrition — 16 products near £22 average, also holding a 4.5 rating and strong review depth.
- Applied Nutrition — 14 products at about £17, keeping pace with a 4.5 rating.
Ratings, however, tell a slightly different story than volume. Olimp Sport Nutrition holds the highest average score among top brands at 4.6 stars, even though it lists fewer products. Warrior, despite leading on count, sits at a 4.2 rating, which is respectable but trails the premium pack. The lesson for anyone doing Amazon UK creatine market analysis is that dominance by product count and dominance by customer satisfaction are two separate crowns.
What Reviews Reveal About Buyer Trust
Review volume and ratings provide useful signals of customer experience and product popularity. The single most-reviewed product in the category, from Nutricost, carries more than 335,000 reviews while holding a 4.7 rating. Several other listings sit in the 116,000 to 270,000 review range, and almost all of them stay between 4.5 and 4.7 stars.
What makes review data so useful for creatine product trends:
- Products with heavy review volume paired with high ratings signal proven demand, which helps forecast which formats keep selling.
- A brand appearing multiple times in the top-reviewed list, as Optimum Nutrition does with three separate products, shows durable shelf strength rather than a one-hit listing.
- The stability of ratings across different price points suggests that customers evaluate these products on more than price alone.
One caution worth stating plainly: review counts measure customer satisfaction, not ingredient purity or lab testing. Shoppers who care about quality should look for third-party certifications on the listing itself. For businesses, though, reviews remain one of the richest fields in any Amazon UK creatine data pull.
From Raw Listings to Usable Market Data
Manually monitoring hundreds of Amazon listings becomes difficult to maintain as product counts, prices, ratings, and seller information change. Instead of copying figures one page at a time, an automated pipeline captures the entire category in a single sweep and returns clean, comparable fields.
A well-built scrape typically pulls the following from each listing:
- Listed price and any discount or deal indicator
- Average star rating alongside total review count
- Brand name and the third-party seller behind the listing
- Category classification across all sub-groups
- Prime eligibility and sponsored-listing status
- On-listing sales-volume signals where Amazon shows them
These fields are the raw ingredients for real supplement market intelligence. Once organized, they reveal patterns no single product page ever could, from pricing bands to advertising intensity.
How Retailers Can Use Amazon UK Creatine Data for Competitor Tracking?
Competitor tracking is one of the strongest use cases for this data. When you watch the whole category rather than a handful of listings, competitive moves become obvious well before they show up in sales figures.
Practical ways brands apply this intelligence:
Price benchmarking
Compare your products against category averages and competing listings.
Competitor visibility monitoring
Track sponsored placements and marketplace visibility.
New-brand detection
Identify newly appearing competitors.
Review and rating benchmarking
Compare customer feedback signals against category leaders.
This is the everyday value of creatine price analysis UK work: it converts a noisy marketplace into a readable competitive map. For supplement brands that need this information continuously, automated marketplace monitoring can turn these snapshots into an ongoing competitive intelligence workflow.
Why Retailers Need Continuous Tracking
For retailers, the payoff is continuous visibility rather than a static report. A one-week snapshot is a starting point, but real advantage comes from tracking how prices, ratings, and rankings shift over time. Continuous Amazon supplement data scraping lets a retailer spot a competitor’s price drop within hours, adjust their own positioning, and protect margin without guesswork.
In the analyzed dataset, approximately 89% of listings were marked as Prime-eligible. Shipping speed is nearly universal, which means pricing and reviews carry even more weight in the buyer’s decision. That reality makes ongoing supplement market intelligence less of a luxury and more of a baseline requirement for anyone serious about the category.
Conclusion
The 2026 Amazon UK creatine market is highly fragmented, with 429 products across 232 brands and prices ranging from £3.50 to £69. Review volume, customer ratings, product breadth, and marketplace visibility add further layers to the competitive picture. Prices swing widely, review volumes climb into the hundreds of thousands, and the winners are the brands that understand both value positioning and customer trust. A thorough Amazon UK creatine market analysis shows that price alone never tells the full story; ratings, reviews, and sponsored activity together paint the real map.
For brands and retailers, the takeaway is simple. The insight already exists inside public listings, waiting to be organized. Whether you want to benchmark pricing, watch competitors, or forecast creatine product trends, structured data is the fastest route there. At RetailGators, we help teams turn Amazon UK listings into the kind of clean, reliable intelligence that drives real decisions. Explore our data services at RetailGators and put this market to work for you.