Introduction
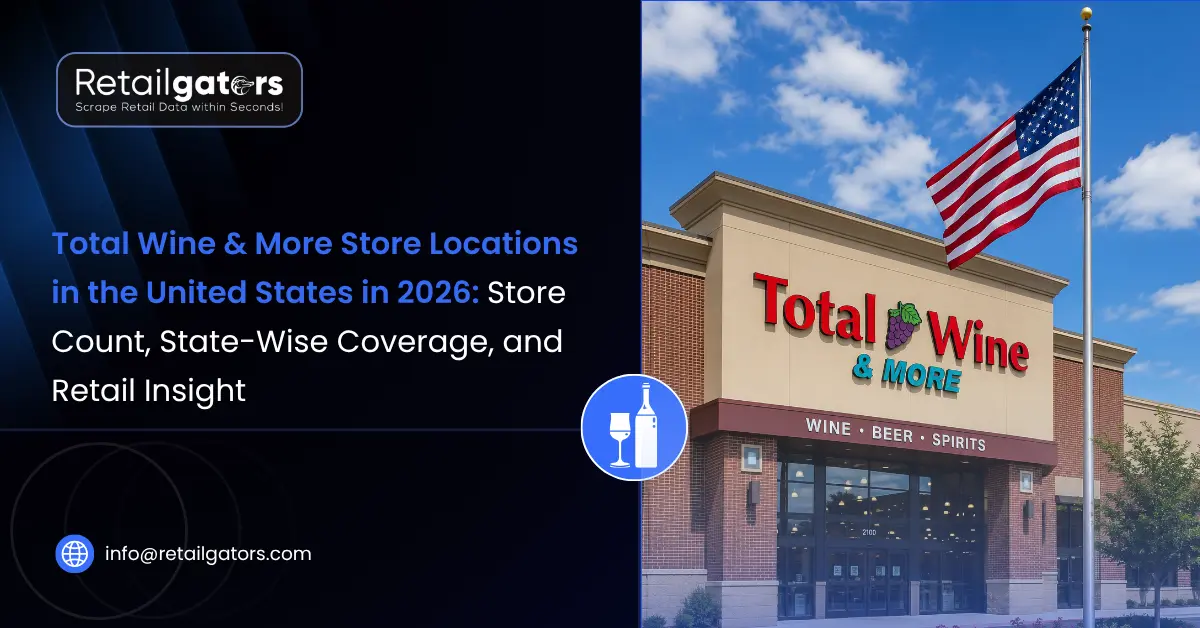
Total Wine & More store locations in the United States offer valuable insights into the country’s evolving beverage retail landscape. In 2026, the retailer continues to strengthen its retail footprint, making its store network a reliable benchmark for businesses involved in retail market research, location intelligence, competitor analysis, and expansion planning. By analyzing the Total Wine store count, Total Wine stores by state, and regional distribution, retailers, suppliers, investors, and real estate professionals can identify high-demand markets, uncover growth opportunities, and make informed business decisions backed by data.
This report shows the latest Total Wine & More store locations, state-wise coverage, regional presence, and the strategic insights hidden within liquor store location data. You will find where the brand has its strongest presence, how its expansion strategy reflects consumer demand, and why retail location intelligence has become essential for modern market analysis. Whether you’re evaluating new markets, benchmarking competitors, or studying retail trends, this comprehensive analysis provides the actionable insights needed to understand one of America’s leading beverage retailers and the broader specialty alcohol market.
Total Wine & More Store Count in the United States (2026): Latest Data & Insights
With nearly 300+ Total Wine & More store locations across the United States in 2026, the retailer continues expanding strategically into high-demand markets, making its retail footprint an important benchmark for market research and location intelligence. The exact count depends on which data provider you check, since each location intelligence platform refreshes on its own schedule. Taken together, the reported figures place the chain at roughly 280 to 340 active stores nationwide in 2026.
Here is how the leading sources compare:
- One widely cited store location dataset counts 296 Total Wine & More stores in the United States as of June 23, 2026, with California holding the most locations at 47 stores. That same report notes the brand operates in 32 states and territories.
- As of June 2026, a commercial dataset vendor lists 339 Total Wine & More locations in the US in a CSV format with 12 fields per record.
- A daily-updated location intelligence platform reports 279 Total Wine store locations across 29 states.
This spread tells a clear story. The retailer is not chasing rapid, risky expansion. It grows intentionally, as it did with the opening of large-format stores in already high-demand markets. Context is on its side: The company was on track to hit 300 locations by the end of 2025, opened 14 new stores in 2024 and had $6 billion in annual revenue. For anyone tracking Total Wine locations USA, the takeaway is consistency. The company grows in a way that is easy to predict, which makes its retail footprint a reliable benchmark for the whole specialty alcohol sector.
Total Wine Stores by State: Where the Brand Has the Largest Presence
Store distribution is far from even across the country. A small group of states carries most of the brand’s national presence. These leading states share three traits: large populations, friendly alcohol laws, and high consumer demand for premium products.
The table below shows the top states by store count, based on recent 2026 location reports.
Total Wine & More: Top States by Store Count (2026)
| Rank | State | Store Count | Region |
| 1 | California | 46–47 | West |
| 2 | Florida | 40–41 | South |
| 3 | Texas | 38 | South |
| 4 | Virginia | ~20 | South |
| 5 | Maryland | ~18 | Northeast |
| 6 | Georgia | ~17 | South |
| 7 | North Carolina | ~15 | South |
| 8 | Arizona | ~14 | West |
| 9 | Illinois | ~13 | Midwest |
| 10 | Washington | ~12 | West |
Multiple location intelligence platforms agree on the leaders. One report confirms California leads with 46 stores, followed by Florida with 40 and Texas with 38. Another notes that California alone accounts for about 16% of all Total Wine & More stores in the US. These few states hold the large majority of all Total Wine stores by state, since their size and spending power suit a warehouse-style model. This is exactly the pattern strong retail store location data helps you spot at a glance.
Need Total Wine & More location data for your own analysis?
RetailGators delivers clean, structured store location data — geo-coded addresses, store counts by state, and regional coverage you can plug straight into your models. Skip the guesswork and start with verified numbers.
Total Wine Regional Coverage Across the United States
Regional coverage reveals where the brand is dense and where it still has room to grow. The South has the most stores, closely followed by the West. The Midwest and Northeast trail behind, though both regions have seen steady gains.
Here is how the regional picture breaks down:
- South: The strongest region by a clear margin, thanks to relaxed retail rules and a growing suburban population. Cities like Miami and Charlotte rank among the highest store concentrations.
- West: A close second, powered by California and Arizona demand, plus a strong Las Vegas cluster.
- Midwest: A rising region where the brand once had a thin presence and now expands each year.
- Northeast: Smaller but steady, with tighter regulation slowing growth.
Most stores sit in high-income suburban shopping centers rather than dense city cores. This suburban focus supports easy parking, larger floor space, and lower lease costs. For teams studying beverage retail location intelligence, this urban-versus-suburban split is one of the most useful signals in the entire dataset.
How Do Businesses Use Total Wine Store Location Data for Expansion Planning?
Store location data is far more than a list of addresses. It is a strategic asset. When you map where a leader like Total Wine chooses to open, you learn where demand is proven and where competition will be fierce. You also learn where gaps remain.
Here is why this data drives smart decisions:
- Expansion planning: Highlights the regions, which have an adequate demand for premium alcoholic products vs. areas that are underserved.
- Competitor analysis: Compares the market access of the brand with competitors. According to one of the reports, the brand Liquor Barn is operating only in 23 locations in Kentucky as of June 2026.
- Real estate strategy: Assists developers in locating zones with potential anchor-tenants and busy traffic corridors.
- Demand forecasting: Connects the placement of stores to income levels of population, growth, and regulations in the area.
Good liquor store location data converts guesswork into facts. Instead of assuming where growth should happen, you can see where a market leader has already voted with its capital. That clarity lowers risk and sharpens every expansion plan.
Retail Insights from Total Wine Store Location Data
The insights run deep once you connect store placement to market behavior. Total Wine’s retail footprint acts almost like a heat map of premium alcohol demand across the country. Brands, suppliers, and analysts can read that map in several ways.
Key insights include:
- Market saturation levels: You can see which states are crowded and which still have open room. One report measures density down to a store for every 477,289 people in Florida.
- Growth direction: The move from urban cores toward suburban belts signals where future stores will land.
- Product mix signals: Store scale reflects sales mix, where spirits account for 43% of sales, wine 38%, and beer and other items the remaining 19%.
- Competitive strength: The brand serves roughly 18.5 million customers each year and sells an estimated 260 million bottles annually, which sets the pace others follow.
For a distributor or a craft producer, this wine store location data shows exactly where shelf space and demand overlap. For a retail strategist, it frames the whole competitive field. This is the real power of strong retail store location data applied with purpose.
How does Location Intelligence Transform Retail Store Location and Data?
Location intelligence takes raw store data and turns it into a working strategy. It layers store points over income maps, population trends, and legal rules to show the full picture. That blend is what separates a simple address list from retail market understanding.
With strong location intelligence, brands can:
- Measure true market coverage rather than guess at it
- Rank new markets by demand strength and legal fit
- Spot white-space zones where no strong player exists yet
- Benchmark their own reach against proven category leaders
This is where beverage retail location intelligence earns its value. It answers the practical questions that drive budgets and board decisions. When you combine accurate wine store location data with smart analysis, you stop reacting to the market and start planning ahead of it. That shift is the whole point of studying a retail footprint like this one.
Conclusion
The Total Wine store locations map in 2026 tells a story of steady strength. Reported counts place the brand in the 280-to-340 store range, it leads its category by a wide margin, and it still holds clear room to grow in the Midwest, the Northwest, and parts of the Northeast. Its suburban, large-format model shapes where it lands and why.
For retail teams, the lesson is simple. Storing data is a strategy. Whether you track Total Wine store count, study Total Wine stores by state, or dig into wider liquor store location data, the patterns point straight to opportunity. Coverage shows demand, gaps show potential, and consistency shows discipline.
At RetailGators, we help brands turn this kind of retail footprint data into clear, usable retail intelligence. If you want to map coverage, study competitors, or find your next open market, strong retail store location data is where every smart plan begins. Explore how location intelligence can sharpen your next move with RetailGators.
Get Total Wine & More store location data built for your team
RetailGators helps brands, analysts, and retail planners turn raw store retail footprints into clear retail location intelligence. Map coverage, track competitors, and find your next open market with data you can trust. Talk to RetailGators today and get a free sample dataset to start.