Starbucks has thousands of locations across the United States, but its stores are not distributed evenly across every state. So, how many Starbucks stores are in the U.S. in 2026, and which states have the largest share?
This guide explores the Starbucks U.S. store count, ranks leading states by location count, and compares the chain’s footprint with Dunkin’. It also examines Starbucks’ expansion plans and explains how businesses can use store location data for retail site selection, competitor analysis, and market research.
The figures are based on company disclosures and third-party location datasets, with their sources and reporting dates identified wherever available. Because store openings, closures, and relocations can change the total, official company figures and estimated location counts are treated separately throughout the article.
How Many Starbucks Cafes Are in the U.S. Right Now?
Starbucks’ U.S. store count depends on the reporting date and the source used. For the most reliable company-reported figure, start with Starbucks’ latest fiscal 2026 results and identify the reporting period alongside the total. Third-party location datasets can provide a separate view of the footprint, but their counts may differ because of update schedules, listing coverage, and counting methods.
That total splits in two, which matters if you work with store distribution data. Around 10,000 cafes are company-operated, run directly by Starbucks. The rest are licensed spots inside grocery stores, airports, hotels, and college campuses. Globally, the brand counted 41,129 cafes at the end of fiscal Q2 2026, with the U.S. and China sitting far ahead of every other market.
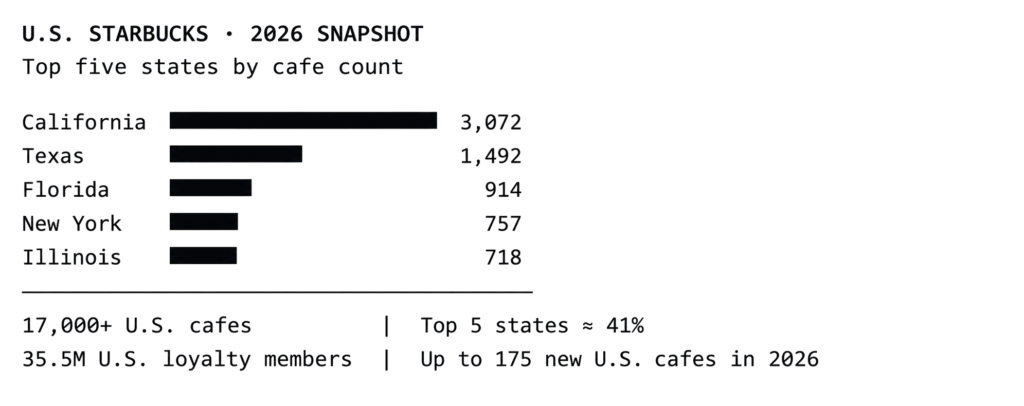
17,000+ U.S. cafes · ~10,000 company-operated · ~7,000 licensed · 50 states + D.C. & territories
California Leads the Starbucks Map
California wins, and it isn’t close. The state holds about 3,000 cafes, roughly 18% of all U.S. locations. That fits its size, its dense metros, and its long history with the brand. Texas takes second. Florida, New York, and Illinois follow, and Washington, Starbucks’ birthplace, lands right in that same fifth-place mix depending on whose data you read.
Review Starbucks locations by state, and the top of the list carries most of the weight. Five states hold roughly 41% of every U.S. Starbucks. That lines up with where Americans live and spend. The West Coast is still home base, while the South and Mountain West keep adding cafes year after year.
Starbucks vs. Dunkin’: How the U.S. Footprints Compare
Scale is where Starbucks pulls away from its closest competitor. With more than 17,000 U.S. cafes, it carries a far larger footprint than Dunkin’, which runs roughly 9,700 shops nationwide a gap of around 7,000 locations. The two brands also compete on different turf. Starbucks operates in all 50 states plus D.C., while Dunkin’ still skips several states entirely and leans hard on the Northeast, with Massachusetts as its stronghold.
The contrast is sharpest out West. California alone holds about 3,000 Starbucks, and in Washington, Starbucks’ home state, Dunkin’ barely registers. For anyone studying store distribution, that split matters: Starbucks reads as a coast-to-coast national brand, while Dunkin’ reads as a regional leader pushing outward. Mapping both footprints side by side is one of the clearest ways to spot white space in the U.S. coffee market.
Starbucks Locations by State (Leading Markets)
The table ranks the states with the highest store counts, with each one’s rough share of the national total. Numbers are rounded and blend company-run and licensed cafes. See the dated sources below the table.
| Rank | State | Store locations | Share of U.S. total |
| 1 | California | 3,072 | 18.1% |
| 2 | Texas | 1,492 | 8.8% |
| 3 | Florida | 914 | 5.4% |
| 4 | New York | 757 | 4.5% |
| 5 | Illinois | 718 | 4.2% |
| 6 | Washington | ~728 | ~4.3% |
| 7 | Arizona | ~607 | ~3.6% |
| 8 | Virginia | ~521 | ~3.1% |
| 9 | Ohio | ~519 | ~3.1% |
| 10 | Colorado | ~512 | ~3.0% |
A Note on the Data: Sources, Method, and Limits
Because store counts move constantly, it helps to know where these numbers come from.
- Company-reported figures. The national total, the company-operated count, global cafes, loyalty membership, and expansion targets all trace to Starbucks’ own fiscal Q2 2026 report and its January 2026 Investor Day. Treat these as verified.
- State-level counts. These come from third-party datasets built on Google Maps and store-locator listings, not from Starbucks directly. They’re best read as close estimates, since scrapers capture different snapshots on different dates.
- Counting method. Totals include both company-operated and licensed cafes. A “licensed” location is a Starbucks inside a host venue such as a supermarket or airport.
- Known limits. Cafes open, close, and relocate week to week, so any single count has a short shelf life. A complete, current 50-state breakdown needs a maintained location database rather than a one-time snapshot.
Which States Have the Most Starbucks Per Person?
Raw counts favor big states, but density per resident tells a different story. Washington, where the company was founded, leads the country with roughly one Starbucks for every 7,700 people more than double the national rate of about one per 20,000. California posts strong numbers too, close to one cafe per 13,000 residents, well above average despite its size.
The pattern follows income, commuting habits, and plain familiarity: the West Coast grew up with Starbucks, so it carries more cafes per capita than regions the brand reached later. Low-density states sit at the other end. Wyoming, North Dakota, and Vermont have only a handful of locations spread across wide areas. For site-selection teams, per-person density often beats a flat store count, since it flags both saturated markets and genuine room to grow.
What Is Driving Starbucks Store Expansion in 2026?
Starbucks spent last year trimming. This year it’s building again, and its Starbucks store expansion plan (laid out at the January 29, 2026 Investor Day) says a lot about where the sector is headed. Four things stand out.
- New U.S. openings this year. As many as 175 fresh U.S. company-operated cafes are on the 2026 calendar, with central, southern, and northeastern markets getting the most attention.
- A bigger long-range target. By 2028, the roadmap calls for 2,000-plus net new stores worldwide — about 400 of them new company-operated cafes in the U.S.
- Upgrades, not only new builds. The “uplift” renovation program has already passed 300 stores. The goal is more than 1,000 refreshed locations by the end of fiscal 2026, plus 25,000 added seats nationwide.
- Smaller, cheaper formats. Compact layouts built around drive-thru and mobile pickup cost less to open, which lets Starbucks enter markets a full cafe could never justify.
Turning Starbucks Location Data Into Decisions
Store counts make for fun trivia. For a retailer, investor, or real-estate team, though, Starbucks location data earns its keep in everyday work. A few places it pays off:
- Site selection. Proximity to a busy Starbucks is a well-worn signal for foot traffic, so a reliable store map sharpens new-store planning.
- Competitive and gap analysis. Underserved ZIP codes and crowded corridors both jump out once the full footprint is on a map.
- Supply and logistics. Routes, delivery zones, and territory lines all get tighter when cafe coordinates are accurate.
- Market research. Year-over-year shifts show where the brand pushes in or pulls back, a handy read on regional demand.
- Due diligence. Growth momentum versus saturation is far easier to judge with hard figures instead of guesswork.
Why Retail Location Intelligence Matters
A raw count only gets you so far. What changes decisions is retail location intelligence the step where plain addresses become a read on demand, competition, and open territory. On its own, “17,000 cafes” is just a headline. Layer it over population, income, and rival brands, and suddenly it’s something you can plan around.
Teams that do this well spot high-traffic retail areas sooner, pressure-test expansion ideas before the money goes out, and benchmark their own footprint against the category leader. Cafe networks move all year, so this data only helps when it’s fresh. Stale maps lead to stale calls.
Starbucks in the U.S. — 2026 at a Glance
Final Thoughts
Starbucks’ U.S. footprint offers a useful starting point for understanding coffee retail competition, state-level concentration, and expansion patterns. However, store totals tell only part of the story. The reporting date, geographic distribution, and consistency of the underlying data all matter when evaluating a market.
For retailers, investors, and site-selection teams, combining reliable location data with demographic and competitive information can support more informed decisions. Explore RetailGators‘ retail location datasets to assess the available coverage and determine whether they fit your market research needs.