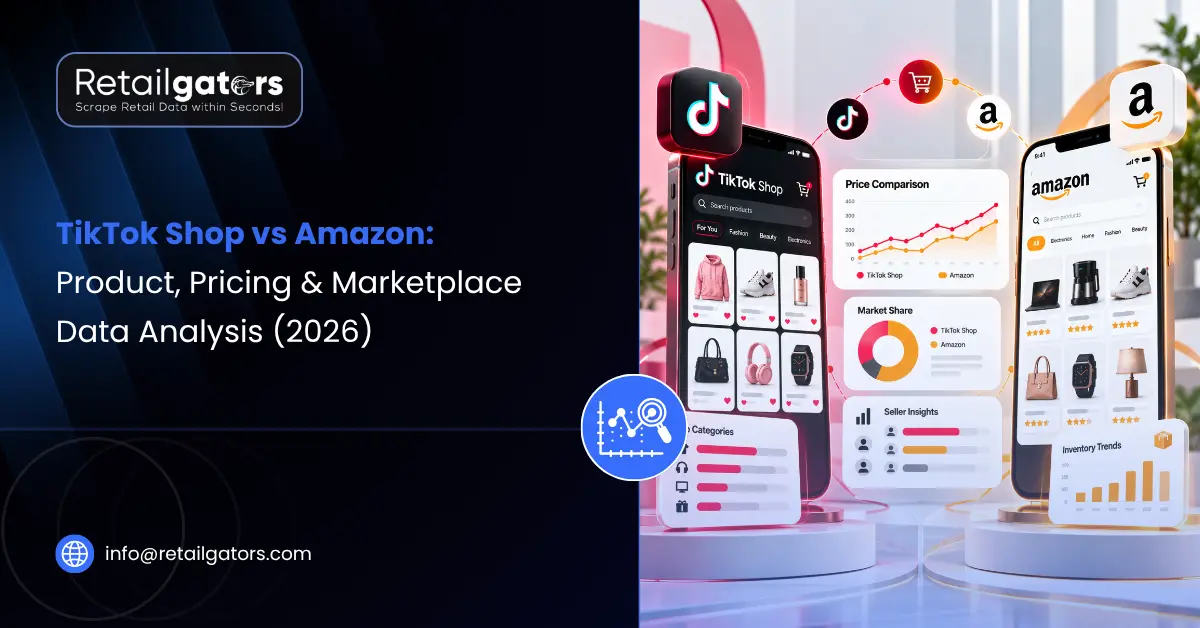
TikTok Shop and Amazon serve different parts of the online buying journey. Amazon is built around search, product research, reviews, and purchase intent, while TikTok Shop relies heavily on discovery, creators, short-form video, and fast-moving trends. Comparing data from both platforms can therefore reveal more than differences in price or product selection.
A TikTok Shop vs Amazon comparison can help brands track product availability, pricing, seller activity, reviews, category demand, and emerging trends across both marketplaces. It can also show where a product performs best and where changing demand may create an opportunity. This guide breaks down the key marketplace data points to compare in 2026 and explains how businesses can use them for pricing, assortment, inventory, and cross-channel ecommerce decisions.
What Data Should You Compare Between TikTok Shop and Amazon?
Amazon remains significantly larger by overall sales volume, while TikTok Shop is growing rapidly and generating strong social-commerce demand. Comparing the two therefore helps brands understand both established purchase intent and emerging product trends.
In the United States, TikTok Shop sales climbed to $15.1 billion, up 68 percent, and the platform captured 18.2 percent of all social commerce. These figures matter because they change how fast a trend can move your stock.
A strong TikTok Shop vs Amazon Data Comparison shows where demand is building before it ever surfaces in your Amazon dashboards, which is why more brands now treat both channels as one connected picture rather than two separate silos that rarely talk to each other.
| Data Category | TikTok Shop | Amazon | Why It Matters |
| Product data | Product title, category, variants | Title, category, ASIN, variants | Compare assortment |
| Pricing | Current price, discounts, promotions | Price, Buy Box, promotions | Monitor pricing |
| Availability | Stock/status where available | Stock/status | Identify supply gaps |
| Seller data | Seller/creator activity | Seller count and Buy Box | Measure competition |
| Reviews | Ratings, reviews, comments | Ratings, reviews | Measure customer response |
| Trend signals | Views, creators, engagement | Search/ranking signals | Identify demand |
| Fulfillment | Delivery/return information | FBA/FBM, delivery | Compare customer experience |
TikTok Shop vs Amazon: Product Catalog Comparison
The shape of the catalog is the first thing that splits these two. Amazon generally offers a broader and more established product catalog, with detailed product attributes, variants, specifications, and reviews supporting search-driven purchases. TikTok Shop has a more discovery-led experience, where creators, videos, live shopping, and emerging trends can quickly increase visibility for individual products. It carries a smaller, trend-led mix where one clip that takes off can shove a single item to the top of its category inside a few hours. That gap means TikTok Shop product data and Amazon product data are really answering different questions.
- Catalog depth: Amazon listings come loaded with specs, variants, and the little detail fields that let shoppers filter down to exactly what they want. TikTok Shop keeps it lighter and lets the video do the explaining.
- What drives visibility: Views, shares, and a creator mention are what get a product seen on TikTok Shop. On Amazon it still comes down to keyword rank and how many reviews you have.
- Data refresh frequency: TikTok Shop trends can change rapidly when products gain traction through creators or viral content. Brands monitoring these signals may need more frequent data collection than they would for slower-moving catalog attributes.
TikTok Shop vs Amazon: Buyer Behavior and Purchase Intent
The buyer sitting behind the data is not the same person on both sites, and that changes everything you read into the numbers. TikTok Shop pulls in a younger crowd, mostly Gen Z and younger millennials, who did not wake up planning to buy anything. TikTok Shop often supports discovery-led purchases, where creators, videos, live shopping, and social engagement influence product discovery. Amazon is more strongly associated with search-led shopping, where customers often begin with a specific product or need.
Around 97 percent of TikTok Shop buyers in the US also shop at Amazon, so you are often looking at the same wallet behaving in two moods. That overlap is the useful part. When your ecommerce marketplace analysis treats these as two sides of one customer rather than two audiences, the demand signals start lining up instead of contradicting each other.
TikTok Shop vs Amazon Pricing Comparison
Pricing is the clearest fault line here, and it is where most pricing work actually earns its keep. Shoppers on TikTok Shop grab cheaper things on impulse. Amazon buyers spend a bit more because they have usually done their homework first. Here is how the main numbers line up.
| Data Point | TikTok Shop | Amazon |
| Average order value | ~$43 | ~$50 |
| Typical referral fee | ~6% | 8–15% |
| Buyer intent | Discovery, impulse | Search, research |
| Common price range | 50 | 100+ |
| Leading category | Beauty & personal care | Electronics & home |
| US GMV (2025) | $15.1B | ~$440B (US share) |
The comparison highlights an important difference in purchase behavior: TikTok Shop can be particularly effective for discovery-driven purchases, while Amazon often captures customers with more established purchase intent. Brands should therefore evaluate price alongside demand, category, competition, and conversion signals rather than comparing price alone.
How Fulfillment and Delivery Affect Marketplace Performance?
Fulfillment can influence conversion, customer satisfaction, returns, and reviews, making it an important variable when comparing marketplace performance. Amazon has spent years building FBA, so Prime delivery and return speed are baked into buyer expectations and, by extension, into conversion data. TikTok Shop is younger here. Its logistics are still filling out, which means delivery times and return handling vary more from seller to seller.
Why does that matter for a TikTok Shop vs Amazon Data Comparison? Because a slow shipping promise can drag down a listing that looks like a winner on every other metric. When you pull product and pricing feeds, it helps to tag fulfillment method alongside them. A cheap item with rough delivery is not really cheaper once refunds and bad reviews catch up with it.
Seller Competition and Marketplace Health
How sellers behave, and how reviews pile up, tells you more about a category’s real health than the top-line sales figure does. These are the signals a solid ecommerce marketplace analysis watches closely.
- Seller concentration. TikTok Shop had 803,500 US stores in 2025, and more than half of them made no sales at all. A small cluster of top shops took the bulk of the money. So the average store number hides what is actually going on.
- Review velocity. Amazon reviews pile up slowly, and they pull a lot of weight in where you rank. TikTok Shop works differently — the social proof shows up in comments and creator videos rather than a star count.
- New-seller pace. Amazon signed up only about 165,000 new sellers in 2025. That is its slowest in ten years, and it points to a market that is settling down.
- Creator influence. Roughly 42 percent of US TikTok Shop GMV comes from affiliate and creator content. Amazon has nothing that works in quite the same way.
Which Product Categories Perform Best on TikTok Shop and Amazon?
Categories do not perform evenly across the two platforms, and the split is pretty telling. Beauty and personal care lead on TikTok Shop, followed by womenswear and food — all things that demo well in a short video. Amazon holds its grip on electronics, home goods, books, and the everyday basics people reorder without thinking. So the same product can be a hero in one place and an afterthought in the other.
A good read of TikTok Shop product data against Amazon product data is not about picking a winner. It is about matching each item to the platform where its category actually sells. Products that depend heavily on specifications, comparison, or established search demand may perform differently from visually demonstrable products that benefit from creator-led discovery.
How Cross-Channel Marketplace Data Supports Ecommerce Decisions
Watching one platform in isolation leaves obvious blind spots, and that is exactly the problem cross-channel ecommerce intelligence was built to solve. When data from both marketplaces sits inside one view, scattered patterns start turning into clear actions:
- Trend-to-inventory planning: Identify products gaining traction on TikTok Shop and compare their availability, pricing, and demand on Amazon before adjusting inventory.
- Price corridor control: Matched pricing across channels protects your margin and stops one listing from quietly undercutting another.
- Assortment gaps: Categories thriving on one platform but thin on the other point toward clear, low-risk expansion moves.
- Review and sentiment health: Combined feedback shows whether a quality issue is isolated or spreading across both channels at once.
What Belongs on Your Tracking Checklist?
A focused tracking plan keeps the whole comparison practical instead of theoretical. On TikTok Shop, the priorities are trending products, creator-linked sales, live-session performance, and the fast price shifts tied to viral demand.
On Amazon, attention belongs on keyword rank, Buy Box status, review growth, and competitor pricing within the same category. When you map these two lists against each other, you get a living TikTok Shop vs Amazon Data Comparison that updates as the market moves, rather than a one-time snapshot that ages badly within a few short weeks.
Conclusion
TikTok Shop and Amazon provide different but complementary marketplace signals. Amazon offers strong visibility into search-driven demand, pricing, reviews, sellers, and product performance, while TikTok Shop can reveal emerging trends, creator influence, and discovery-led demand.
For brands selling across both channels, comparing product, pricing, seller, review, availability, and trend data can provide a more complete view of the market. Instead of treating each marketplace as a separate source, businesses can combine the data to identify pricing opportunities, adjust assortments, plan inventory, and respond to changing customer demand. Regular cross-channel monitoring is especially valuable in categories where trends and prices can change quickly.